👁️🗨️ Images and Infographics in Digital Marketing: The Secrets to Capturing Customer Attention and Hearts
![]()
![]()
# Okay, let’s be honest. In today’s noisy and crowded world of digital marketing, where thousands of content pieces pour down on the audience like torrential rain every second, how can you ensure your message reaches them? Or even, grabs their eyes? The answer is simple, but its execution requires art: with the power of visual content! Remember how they say a picture is worth a thousand words? Truth be told, in this day and age, perhaps it should be said it’s worth ten thousand words, words that no one will have the time to read. Rasavab Afarin has always believed that to be seen, you must be different.
These days, merely writing good text isn’t enough; you need content that acts like a strong magnet, locking the viewer’s gaze in the very first few seconds. And this is precisely where images and infographics step in. These aren’t just pretty pictures; they are strategic tools that can tell your brand’s story in a way that sticks in people’s minds, without the audience even having to read a single word!
In the continuation of this article, we’re going to delve into the tricks and secrets of how you can leverage the power of images and infographics to elevate your digital marketing strategy. From the psychology behind colors and shapes to how to SEO your images, and even the tools you can use to create stunning visual content. This journey is not just a dry guide; it’s going to be a new perspective on tools that are right before our eyes every day, but whose true potential we might be overlooking. Are you ready to uncover the mysteries of this visual game? Let’s go!
🧠 Understanding the Audience: The ABCs of Choosing the Right Image
Well, before you get started and publish every image that looks pretty to you, take a deep breath and ask yourself: “Who is this content for?” You know, it’s like choosing an outfit for a party; you can’t go to a picnic in formal wear or attend a business meeting in sportswear. Your images are the same.
Accurate understanding of your audience is what helps you figure out what kind of visual content, what colors, and what styles they prefer. For example, if your audience consists of young adults and teenagers, lively images, memes, and modern, colorful graphics will likely resonate more with them. But if you’re producing content for corporate managers and decision-makers, you need to go for more professional, serious images, and infographics that present complex data in a simple and authoritative language.
At Rasavab Afarin, we always emphasize that “brand visual identity” is not just a fancy name, but the beating heart of your connection with the customer. This identity must be designed to speak to your audience, not just to you! Consider how important culture and geographical region are; an image that might be considered cliché or even offensive in another country might be completely normal and even attractive here, and vice versa.
So, first and foremost, thoroughly understand your audience personas: How old are they? What are their interests? What are their concerns? Which platforms do they use most? By answering these questions, you can create a list of styles, colors, and even the type of emotions your images should convey. This will help you overcome confusion and produce more targeted visual content that truly resonates with the audience, and not just a fleeting glance. Well, this way, we’ve taken the first step firmly.
Are your online advertisements not striking and engaging enough? Attract audience attention to your business with Rasavab Afarin’s creative banner ads.
✅ Design attractive and impactful banners
✅ Display on relevant websites and applications
✅ Increase click-through rates and brand awareness
Experience professional banner advertising with us!
🎨 Visual Psychology: Colors and Shapes, the Hidden Language of Marketing
Have you ever wondered why some logos or advertisements grab us at first glance, and others don’t? It’s not just personal taste; there’s a lot of psychology behind it! Colors, shapes, and even the arrangement of visual elements all have a hidden language that speaks directly to the audience’s subconscious. Take the color red, for example; urgency, energy, excitement! That’s why we see it so often in discounts or “Buy Now” buttons. In contrast, we have blue, which conveys a sense of trust, calmness, and professionalism. Banks and technology companies also use this color frequently. Green evokes nature, growth, and freshness, and yellow brings joy and optimism.
But it’s not just colors. Shapes also have a lot to say. Circles usually give a sense of unity, community, and softness; like when a brand wants to appear friendly and approachable. Squares and rectangles convey stability, strength, and order, which is excellent for serious and reputable brands. Triangles can represent movement, direction, or even danger, depending on how they are used.
Even visual arrangement matters. The Z-pattern or F-pattern, widely used in website design, shows how the user’s eye moves across the page. If you place your most important message or call to action where the audience’s eye naturally falls, the chances of it being seen and clicked are higher.
Okay, let’s take a look at a few simple examples of the impact of color psychology:
| Color | Feeling Conveyed | Example Application |
|---|---|---|
| Blue | Trust, Calmness, Stability | Banks, Technology Companies |
| Red | Excitement, Urgency, Energy | Discounts, Food, Call-to-Action Buttons |
| Green | Nature, Growth, Health | Organic Products, Environment |
| Yellow | Joy, Optimism, Warning | Children’s Products, Entertainment Brands |
| Purple | Luxury, Creativity, Mystery | Beauty Products, Fashion Brands |
By understanding these basic principles, you can create stronger visual content that is not only beautiful but also plays with the psychology and emotions of the audience, guiding them towards your goal.
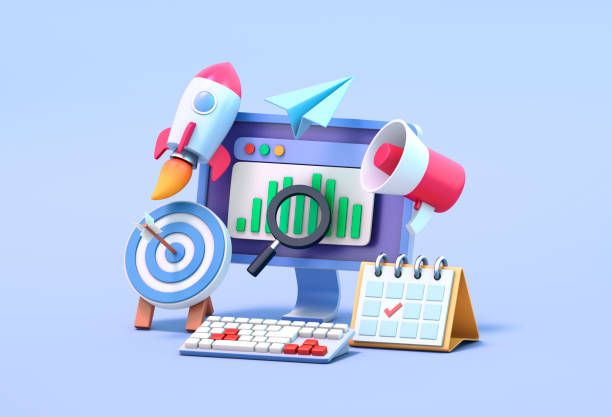
🚀 Beyond Ordinary Photos: Types of Visual Content in Marketing
I remember a time when we were thrilled if we put a good photo on our website! But well, the world has changed, and now a mere static photo, no matter how beautiful, might not be enough to get ahead of the competition. These days, the variety of visual content is so vast that it would truly be a shame to stick to just a few simple photos. Rasavab Afarin, in the discussion of visual content production, always emphasizes innovation and the use of the latest formats.

Click here to preview your posts with PRO themes ››
Let’s take a look at what else we have in the digital marketing arsenal besides ordinary images:
First and foremost, we have infographics; these are truly kings when you want to present a lot of complex information and numerical data in a simple, attractive, and digestible way to the audience. Instead of a long and tedious text, a good infographic can convey all key points to the audience in a few seconds.
Then we get to GIFs and Memes; these two are magical tools for adding a touch of humor and humanity to your brand. Of course, you must be careful to use memes correctly and appropriately so that they don’t look ridiculous. A good GIF can quickly convey an emotion or visualize a small concept.
Oh, how important video is! From short ten-to-fifteen-second videos for Instagram stories to educational and product introduction videos. Nothing can tell a story as completely and emotionally as video. If it’s about Instagram content production, video is gold.
Interactive Content is also making a lot of noise; for example, a visual poll, a quiz, or even an interactive map that the user can play with. These are not only entertaining but also significantly increase audience engagement.
Even 360-degree images or Augmented Reality (AR) can revolutionize the user experience, especially for products that require a detailed view from different angles. In short, the options are endless, and each can in some way contribute to your content marketing strategy. The key to success here is to be creative and not be afraid to combine these tools.
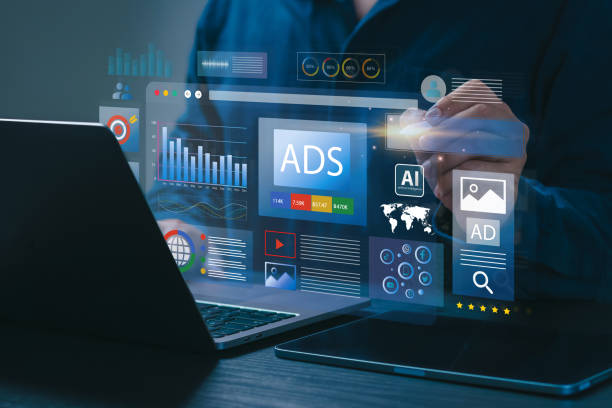
📊 Creating Engaging Infographics: Data in the Language of Images
![]()
![]()
If you deal with a lot of numbers and figures and want your audience not to run away from them, your best friend is an infographic! Indeed, the main goal of an infographic is exactly this: to simplify complexity, eliminate fatigue, and convey information in the blink of an eye. But then, creating a good infographic isn’t just about putting a few charts together; it’s an art that requires both precision and creativity.
The first and most important step is choosing the right data that is relevant to the audience. You don’t need to dump every number and figure you have into the infographic; just select the most important and impactful ones that tell a specific story. An infographic is like a graphic novel; it should have a beginning, a logical flow, and an end that leads the audience to a specific conclusion.
Then we get to design principles. Here are a few basic tips that Rasavab Afarin always recommends to its clients:
• Simplicity, simplicity, simplicity: Avoid cluttering your infographic with too many colors, different fonts, or irrelevant icons. Every element should have a clear purpose.
• Information Hierarchy: Place the most important information at the top or in prominent sections of the infographic so it’s seen at first glance.
• Readability: Fonts should be clear and of an appropriate size. Don’t underestimate the color contrast between text and background.
• White Space: Let white space breathe! This space helps prevent eye fatigue and allows the audience to focus on the main content.
• Data Source: Always cite your data sources at the bottom of the infographic or in a clear place. This enhances the credibility of your work and builds trust with the audience, which is what the E-E-A-T principle also states.
Finally, remember that a good infographic is a powerful tool for content marketing and even SEO. Because it has high shareability on social networks and can help in gaining backlinks. So, invest plenty of time in it.
Is your content on social media, especially Instagram, not effective enough? Rasavab Afarin transforms your page into a powerful marketing channel with creative and targeted Instagram content production.
✅ Produce engaging visual content tailored to Instagram’s algorithm
✅ Increase interaction and organic growth of your followers
✅ Design a content strategy for maximum audience attraction
Contact 09124438174 for Instagram content production!
🔍 SEO for Images and Infographics: How to Captivate Search Engines?

There was a time when we thought SEO was just for text and keywords. But now, we can no longer remove images and infographics from the SEO equation. Google and other search engines have become smarter and can understand visual content to some extent. So why not use this golden opportunity to make our site more visible? Rasavab Afarin, in the discussion of SEO and website optimization, always emphasizes details, and image SEO is one of those important details.
The first and most important thing is alternative text or Alt Text. This is a short description for the image that search engines (and those who cannot see the image) read. Remember: In Alt Text, describe the image and, if logical, include your main keyword. For example, instead of “image123”, write “digital marketing tips infographic 2024”. This not only helps with SEO but also increases your site’s accessibility.
Then we get to the file name. Before uploading the image, change its name to something meaningful and containing keywords. For example, instead of “IMG_0045.jpg”, name it “tarfand-digital-marketing-aks.jpg”. Remember to use hyphens (-) to separate words.
The image size and format, well, I can’t stress enough how important they are. Heavy images slow down site loading speed, which means a negative score from Google! Use optimized formats like WebP or JPEG with appropriate compression. Also, adjust the image size to fit the space where it will be displayed, no larger.
Image captions and titles are also very important. If you take caption writing seriously, you not only improve the user experience but also can naturally embed more keywords into your content.

Click here to preview your posts with PRO themes ››
And finally, the Image Sitemap. If you have many images, an Image Sitemap helps Google find and index your images more easily. These tips may seem small, but collectively, they can have a big impact on your website optimization.
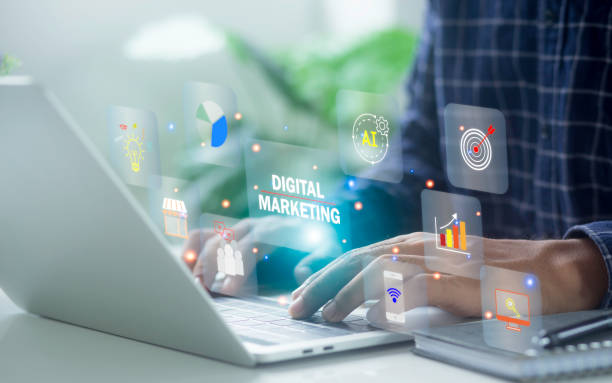
📱 Visual Integration: From Website to Social Media
![]()
![]()
Images and infographics aren’t just for one place; they should flow like a river through all your digital marketing channels, conveying a consistent message. Think of an orchestra; each instrument has a role, but if they don’t all tune together, a chaotic sound will result. Your visual content is the same; it must be present on every platform, but according to its own rules.
Your website is your main home. Large, stunning hero images, high-quality product galleries, and infographics explaining your services should all be carefully selected and designed. These not only enhance the visual beauty of the site but also directly impact the user experience (UX). A site with poor-quality visual content is like a cluttered, disorganized shop where no one wants to spend time.
Then we move on to social media. Here, each platform has its own rules of the game. Instagram is the king of attractive images and videos; creative stories, energetic reels, and eye-catching graphic posts. Telegram is more suitable for informational infographics or educational images. LinkedIn, which has a more formal space, benefits greatly from professional infographics, charts, and industry-related images. Here, Rasavab Afarin can help you immensely with social media management and Instagram content production.
Email marketing is similar. Instead of a text-heavy email, an attractive image in the subject line or at the beginning of the email can multiply the open rate. Of course, be careful that your images aren’t too heavy so they load quickly and don’t create a bad user experience.
Advertising campaigns on Google Ads, banner ads, and discovery campaigns are meaningless without strong images and graphics. Your banner image must convey the message in a few seconds and entice the user to click.
You see, the main point is that across all these channels, your brand visual identity should remain consistent. Colors, fonts, and design style should be your signature, so that wherever the audience sees it, they know it’s yours.
A small table of visual content usage on different platforms:
| Platform | Suitable Visual Content Type | Key Point |
|---|---|---|
| Website | Hero Images, Product Galleries, Infographics | High quality, speed optimization, excellent UX |
| Posts, Stories, Reels, Carousels | Visual appeal, short videos, trends | |
| Telegram | Infographics, Educational Photos, GIFs | Educational value, shareability |
| Infographics, Charts, Professional Photos | Credibility, specialized information, formality | |
| Email Marketing | Header Images, Small Banners, Visual CTAs | Compression, relevance, call to action |
🛠️ Tools and Resources: Your Weapons for Creating Stunning Visuals
Well, so far, we’ve understood how important visual content is in digital marketing and how to use it. But you might ask: “Now, what do we use to create all this?” Fortunately, these days, you don’t necessarily have to be a professional graphic designer to create attractive images and infographics. Of course, an expert designer is always something else, and Rasavab Afarin has a strong team for UX/UI design, but for beginners or lighter tasks, there are plenty of excellent tools at our disposal.
First of all, for those who are not very professional but want to create beautiful work, Canva and Adobe Express (formerly Adobe Spark) are fantastic. These platforms have thousands of ready-made templates, icons, photos, and fonts that you can use with a simple drag-and-drop to create visual content for social media, posters, banners, and even simple infographics. Working with them is really easy and they are an excellent option for beginners.
But if your work is more serious and you want full control over the design, then nothing replaces professional Adobe tools: Photoshop for photo editing and illustration, Illustrator for vector graphics and complex infographics, and InDesign for layout and page design. These require a bit of learning, but the results they provide are exceptional.
Now, where do we get high-quality photos? There are thousands of free and paid stock photo and video websites that you can use. Unsplash, Pexels, Pixabay, Freepik are among those that have plenty of free, high-quality photos and vectors. If you’re looking for something more specific and with professional copyrights, Adobe Stock or Shutterstock are excellent options.
For more specialized infographic creation, tools like Piktochart, Venngage, and Infogram can also be very useful. These are specifically designed for infographics and offer many ready-made templates and visual features for converting data into attractive graphics.
And of course, if you truly lack the time or expertise, you can always count on the help of Rasavab Afarin’s visual content production team. Entrusting the work to professionals not only guarantees the quality of the work but also frees up your time to focus on the core aspects of your business.
📈 Measuring Visual Performance: How to Know if Your Image Was Truly Seen?
You’ve uploaded an image, created a beautiful infographic, and published it everywhere. Now what? Is publishing it enough? Well, of course not! In digital marketing, every move we make must be measurable, and visual content is no exception. How to determine if an image or infographic has truly captivated the audience and brought us closer to our goals is a science in itself.
The first thing you should look at is the Engagement Rate. That is, how many people liked, commented, saved, or shared it. On social media, these numbers tell a lot. An image with high engagement means it has managed to connect with the audience.
Then we get to the Click-Through Rate (CTR). If you have an image or an advertising banner that is supposed to send the user to another page, CTR shows what percentage of those who saw the image actually clicked on it. A high CTR means your image has managed to generate the necessary curiosity. Rasavab Afarin always emphasizes optimizing CTR in Google advertising campaigns or banner advertisements.
Click here to preview your posts with PRO themes ››
The Conversion Rate is the ultimate goal! If your ultimate objective is to sell a product, fill out a form, or subscribe to a newsletter, the conversion rate shows what percentage of those who entered through that image performed your desired action. This is the most important metric for measuring success in online sales.
Tools like Google Analytics or the built-in tools of social platforms give you a lot of data. You can see how long users stayed on your page (Time on Page) after viewing an infographic, or which images caused them to browse your site more. Even A/B testing is very good; test two different versions of an image or infographic simultaneously to find out which one performs better. This way, you can continuously learn and improve your visual strategy. In short, without measurement, we are walking in the dark!
Do you want to leverage the potential of artificial intelligence in your business? Rasavab Afarin, with innovative AI solutions, makes your operations and decisions smarter!
✅ Analyze complex data
✅ Predict market trends
⚡ Prepare your business for the future with Rasavab Afarin!
❌ Common Mistakes and Ways to Avoid Them in Visual Marketing

To be honest, no matter how good you are at something, you might still make mistakes. In the world of digital marketing, and especially in the use of visual content, these mistakes can severely damage your brand and your efforts. So let’s take a look at some of the most common blunders and how we can avoid them.
Firstly, using low-quality or irrelevant images. This is unacceptable! Nothing damages your brand’s credibility like a pixelated, low-quality photo or an image that has no relevance to the topic. It’s like trying to sell a luxury item in torn and dirty packaging. Always invest in quality and make sure the image reinforces your message, rather than detracting from it.
Secondly, ignoring brand visual identity. We said that colors and styles are your signature. If you use a different style or color palette every time, the audience will get confused and won’t be able to easily identify your brand. Brand visual identity should connect all your visual content like an invisible thread.
Thirdly, not optimizing images for speed and mobile. In the mobile era, if you don’t optimize your website or social media pages for smaller devices, you’ll lose half your audience. Heavy images also drag down load speed, and that means saying goodbye to users.
Fourthly, not using alternative text (Alt Text) or using meaningless file names. This is a common mistake in image SEO that we’ve discussed before. By not doing it, you miss a great opportunity to be seen in Google search.
Fifthly, avoiding a clear Call to Action (CTA). If your goal with an image is for the user to perform an action, you must tell them explicitly with a clear CTA. A “Shop Now” or “Read More” button highlighted with good visual design can make a big difference.
In summary, with a little care and by following these tips, you can avoid falling into these pitfalls and ensure that your visual efforts in digital marketing are fruitful.
| Question | Answer |
|---|---|
| Why are images and infographics important in digital marketing? | Visual content conveys information faster and more effectively, attracts audience attention, increases engagement rates, and helps with branding. |
| What is Alternative Text (Alt Text) and why is it important for images? | Alt Text is a short description of the image read by search engines and visually impaired individuals. It helps with image SEO and improves accessibility. |
| How can I determine which color is suitable for my brand? | Color selection should be based on color psychology, your brand’s identity and values, and of course, understanding your target audience. Each color conveys a specific emotion. |
| What is the best format for uploading images to a website? | WebP, JPEG, and PNG are among the most common and optimized formats. WebP is usually the best option for loading speed and quality. |
| Is using GIFs and Memes professional in marketing? | Yes, if used correctly and appropriately with brand identity and target audience, they can help increase engagement, humanize the brand, and add a touch of humor. |
| How can I measure the performance of my infographics? | You can use metrics such as engagement rate (likes, comments, shares), Click-Through Rate (CTR), and Conversion Rate. Website analytics tools and social media platforms are useful. |
| Why should I optimize my images for mobile? | Most internet users access websites and social media via mobile. Mobile-optimized images provide a better user experience and help with site SEO. |
| Can I use free stock images in my commercial content? | Yes, many websites like Unsplash or Pexels offer high-quality, free images that can be used for commercial purposes. However, always check the copyright rules of each site. |
| What is the importance of visual consistency across different marketing channels? | Visual consistency leads to easier brand recognition, strengthens brand identity, and builds trust with the audience. The audience should recognize your brand uniformly across every platform. |
| What is the difference between visual content production and graphic design? | Visual content production focuses more on creating targeted visual content for marketing (such as product photos, advertising banners, infographics), while graphic design encompasses a broader field including visual identity, packaging, and so on. |
And other services of Rasavab Advertising Agency in the field of advertising
• Consultation and implementation of AI tools for customer service
• Advanced SEO for custom schemas
• Production of branding animation videos
• Advertising campaigns on online news platforms
• Design and development of campaign management systems
And over hundreds of other services in the field of internet advertising, advertising consultation, and organizational solutions
Internet Advertising | Advertising Strategy | Advertorials
How to ensure customer loyalty?
Design effective loyalty programs by analyzing customer data.
✅ Design successful loyalty programs
✉️ info@idiads.com
📱 09124438174
📞 02126406207
Tehran, Mirdamad Street, next to Central Bank, Southern Kazeroun Alley, Ramin Alley, No. 6